In our investigations of children’s understanding of the mathematics of data, we identified ideas that were particularly interesting or empowering to children, and watched where they spontaneously made mathematical games and challenges for themselves. Interwoven with this process was our own deepening understanding and enjoyment of this branch of mathematics. Taking cues from children’s aesthetics as well as our own, in effect we found the “game in the math” rather than putting math in a game. And, almost by necessity, the math looks different from how it does in a classroom.
Zoombinis and the Art of Play
Chris Hancock, Scot Osterweil (1)
Gary stager a colleague of mine from our Logo days together views curriculum from a unique perspective. He states: “I coined the term, ‘learning adventure,’ to replace ‘assignment’ in describing classroom activity. Assignment connotes a requirement to be endured regardless of personal taste, experience, aptitude or motivation. ‘Learning adventure’ implies excitement, challenge and personal benefit. It is for you; an assignment is for the teacher. This seemingly simple rhetorical shift has had a profound impact on the spirit and effectiveness of my tertiary and P-12 teaching.”2
Aligning with this shift in perspective, this chapter will focus on providing experiences for students that go beyond mere academics, experiences that capture the mystery and spirit of the hunt; The prime example being a compelling story with a challenge students will want to pursue. The components – a beginning (stage setter), a middle (challenge, conflict and perplexion) and an ending (with some kind of resolution.) In the process students (and teachers) will learn the skills and incorporate the ideas that stakeholders hold dear for their students to know.
For example, the age old fear for most students is what I call the fractions barrier. How can we have an adventure that gets students to “know” what fractions are? Just in case you have forgotten, fractions are defined as parts of a whole. As the whole gets divided into more parts the parts become smaller. When written as a symbol, a fraction has a single value even though it uses two whole numbers to express it. A fraction can also be thought of as the quotient in a division problem (numerator divided by the denominator) which magically turns into a decimal number. The fraction can even be a percent. A fraction is really a master of disguise and the challenge to the student is to know what form to use for a given situation. 3/4 is fine for describing the 3 pieces out of the 4 in a candy bar. But, suppose you break off one of the pieces, is it no longer 1/4 or is it a new whole? Keeping an eye on the whole is the key to understanding fractions. But now I’m making it too hard too soon. Let’s go back to a fraction being a master of disguise.
The trouble with fractions
Mastering fractions is a strong indicator of future math success. We have to pay our dues at the fraction tollbooth before we can travel the highway to – Algebra 1. Tom Hanks in the movie, “A League of their Own” captures the dilemma perfectly when confronting a discouraged female baseball player who wants to quit the team and says it got too hard. “It’s supposed to be hard, if it wasn’t hard everyone would do it. It’s the hard that makes it great!” You’ve got to be great to master fractions in elementary school because most likely you don’t have a great teacher in place.
Conceptua4 and other companies are trying to flatten the barriers to fraction mastery through the use of technology, but as we learned from Rick Hess the digital platform approach is not quite there yet.4 So much depends on teachers, administrators, IT specialists to get their acts together. Choosing Conceptua would help, but if you are using a standard textbook along with it your chances of your students gaining fraction mastery are slim.
The Weird Number to the Rescue
Back in 1970 I saw an animated film that changed my perspective on teaching fractions. It was called The Weird Number.5
Here’s the narration from the movie:
“My story concerns a strange event that took place in a little town nestled in the mountains. A little town inhabited only by natural (counting) numbers, but whenever the townspeople gathered together rumors were exchanged; rumors that other numbers lived in the dark woods beyond the mountains but no one could imagine a number that wasn’t a natural number so no one believed the rumor.”
So starts the story of the Weird Number a delightful excursion into a fantasy world of a town inhabited by natural numbers. Two citizens of this town – 9 the baker – and – 736 the sheriff – play key roles in the development of the story.
The narrator continues:
“Now one thing that never happens in this town is robberies. This is because the thief is easily identified since the number of items stolen is always the same as the number of the thief. For example, if 4 stole something, he would steal 4 of that particular item so he would be easily identified. Therefore, there were never any robberies. But one day there was a robbery. 9 who was the baker rushed over to the sheriffs office to tell him about the robbery. ‘What was stolen?’ the sheriff asked 9. “Just a little piece of bread.” replied 9. ‘One piece of bread?’ said 763. ‘I can’t believe it. One is the mayor. He would never steal.”
“No, no,” said Nine, “not one piece of bread, a little piece of bread.”
“Not one piece of bread, but a piece,” said 763. “What kind of nonsense is that?’”
Actually it makes a lot of sense once you understand who the thief was. It turned out to be 2/3 a number totally unknown to the residents of this town. The sheriff organized a posse to catch the thief, but 2/3 was a clever escape artist because as we mentioned before he was a master of disguise. When the posse discovered his location in a barn, he stepped out wearing his 4/6 disguise and told his pursuers that he had no idea where 2/3 was. In the meantime the posse learns from 4/6 a trick that all whole numbers are capable of since they are also masters of disguise. For example, One the sheriff could become 2/2, 3/3, 4/4 etc. 5 could become 15/3 and so on.6
Soon after 4/6 left them, 763 realized that 2/3 and 4/6 were one and the same number. So he continued to pursue him. But he was always clever enough to take on a new form (in this case 18/27) to outwit the sheriff.
After the whole numbers realized their ability to transform into other forms numbers in fractional form became a common site on the town square. Even 2/3 was not afraid to hangout in town, albeit in a different form.
The movie ends with this cliffhanger that inspires a wannado followup.
The fractions and whole numbers are sitting around at tables in a pub pleased as punch that they were all members of the same number family when they learned of rumors that were other kinds of numbers living in the dark woods beyond the mountains. Numbers that could not be written as a natural number on top and natural number on the bottom. But no one paid any attention to that. The movie ends with a flash of lightening in the window followed by “The End” splashed on the screen.
After I saw this movie for the first time I was hoping for a sequel, but it never materialized. So who or what were these mysterious non rational (irrational) numbers?
Here’s a suggested activity for your class: Have your students create a video sequel about this mysterious number.
What kind of story line could you have? Here’s a suggestion. Start off with this:
“It’s a stormy day on the sea off the coast of Greece. The year is around 520 BC. A man, fighting for his life, is heaved over the side of a boat and plummets into the open sea to die. His crime? Stealing the crown jewels? Murdering the King? Nope. It was telling the world a mathematical secret. The secret of the dangerous ratio.This was the fate of Hippasus, a follower of Pythagoras who was forced to walk the plank and drown as a punishment for this crime. it’s difficult to imagine what a stir it created when it was first proposed! The Pythagoreans just couldn’t imagine that there was no ratio that equaled the length of the diagonal of a 1 unit square. The value was the square root of 2 – an irrational number. So they wanted to keep it a secret thus Hippasus who knew otherwise was doomed to his fate.7
This kind of assignment would be a common occurrence in the Wannado classroom.
The Stock Market Game
Another significant Wannado activity was my take on the Stock Market Game (currently available on line.8) I figured that anything to do with making money (even imaginary money) would be a sure fire winner for middle school aged kids.
Back in 2007, in Elizabeth, NJ, all 8thgraders were participating in the online version of The Stock Market Game. At that time I was working with a 6thgrade group and wanted to do something similar with them. My opinion that the online version would be too difficult for the younger kids was born out by the struggles the 8th graders were experiencing with it. So, I came up with variation of the game that I thought would be more appropriate. In my thinking about how best to create this unit, I remembered the success I had playing the Stock Market Game with my Carteret students (See chapter 3 in my book.) Making money is a huge motivator. I could also weave in the historical content of the stock market crash – with photos of actual bread lines, etc. to make it real. Because there is a story attached to the math, I knew the students would be more interested. I was right.
So here is the description of the game I created.
The 6th grade Stock Market simulation was inspired by an old Milton Bradley board game called Stocks & Bonds.
- Five teams compete.
- Each team starts with $10,000 and they buy and sell from a list of 10 stocks – companies that were familiar to most students.
- Apple Computer
- Disney
- General Motors
- GAP
- Home Depot
- Coca-Cola
- McDonalds
- Microsoft
- Nike
- Papa John’s Pizza
- There are 10 rounds of price changes based on real data from the actual historical records of each company.
- Team with the most earnings at the end of 10 rounds is the winner!
I ran this game in partnership with Steve Siracusa, their 6th grade teacher. My long term goal was to have him do the game the following year which is always my goal in my teacher partnerships.
Each week the student groups selected the stocks they wished to buy and sell filling out a spreadsheet template that we had developed together.
I would return the following week and share the new prices for their stocks. Then they would determine which stocks they wish to buy and/or sell. This was repeated for a total of 10 weeks. At the end of this time the team with the highest net value would be the winner.
After a slow start the winning team came through big time by almost doubling ($19,349.50) their starting amount ($10,000) which was a 93.5% return on their initial investment. What was their secret for success? They bought and kept 150 shares of Apple stock which shot up through the roof in Round 10!9
Ideally, the students would do this again the following year but this time with current stock market data. Possibly even play the online version of the game mentioned before.
Measuring the Circumference of the Earth
In 1972, I came across an article in an issue of The Mathematics Teacher that described one teacher’s effort to collaborate with another school in an attempt to duplicate the astonishing work of Eratosthenes, an ancient librarian who successfully measured the circumference of the earth from Alexandria, Egypt, in approximately 200 B.C. I was inspired to try the activity with my second-year algebra class. I attempted to involve two schools—one in Michigan and the other in Florida—but, sadly, nothing materialized.
Fast forward to 1995. While creeping along the Internet (surfing was in its infancy), I read that a high school mathematics teacher in Illinois was hosting something that she called the Noon Observation Project. It turned out to be a worldwide collaboration among schools that sought to recreate what Eratosthenes had done so long before. Because the experiment requires participants to measure shadows at about the same time (when the sun is at its highest point in the sky), “real-time” communication is extremely important. E-mail turned out to be a great way to do this.
I found out later that this online project dated back to at least 1988 when Jim Levin at the University of Illinois, with the help of Al Rogers and his FrEdmail network, made such an experiment practical. Because I was working mostly with elementary and middle school teachers in workshops that I led at the Center for Improving Engineering and Science Education (CIESE), I was tempted to get involved but held off, thinking that the use of trigonometry would be a barrier for many of my teachers. So I put this project on the back burner.
A year later, while visiting my favorite “library,” Barnes and Noble, I came across a children’s book with an intriguing title, The Librarian Who Measured the Earth by Kathryn Lasky10, and read it while standing in the aisle. (One of the delights of a children’s book is the magic it can create in its brevity.) The book was wonderful, but I did have one problem with it: All of the mathematics involved was on one page and probably beyond the understanding of the intended audience. This sparked an idea and a challenge. I wanted to explain the mathematics behind this story in a way that children could understand. Little did I know what I was getting myself into.
The process of making the mathematics comprehensible took me on a fascinating learning journey. One thing I learned is how important good physical models are in representing real-world phenomena. Concepts such as how the earth revolves around the sun seem simple at first glance, but they can be quite hard to conceptualize, unless you have something to look at and turn in your hand. Language is another hurdle. I’ve read many descriptions of the phenomena that I describe here, and most are intended for an older audience. My challenge was to explain it at a level that invites understanding at a younger age. Unfortunately, I don’t think I accomplished my goal. Most kids who would find the Lasky book interesting would still not be able to understand most of what I describe here, but I think this is a step in the right direction. My attempt at getting at the essence of ideas and trying to explain them in a kid-friendly way is very useful. I admire writers of children’s books, because they think about this more than anyone else does.
I also gained an appreciation for the relationship between mathematics and science. Separating the two disciplines deprives students of seeing how they are intimately linked. A colleague of mine at Stevens of shared these thoughts when I asked him about the way math and science ‘go together’:
Why do we have washboard (some say corduroy) dirt roads, should you vote in an election about whose candidates you know nothing, if light from the sun is parallel when it falls on the earth, how come it flares out when it shines through a hole in the clouds, why don’t bugs have lungs, what does the weatherman mean when he says there’s a 20% chance of rain, how can it be that the water level is going down when the tide is coming in, etc….? All these questions and thousands of others require, for their explanation, a bit of science married to a bit of mathematics. Like a poem you come to love even more after study, such understanding heightens your appreciation for the world around you and provides a never ending source of joy. In the process you come to treasure both….
Roger Pinkham, Professor of Mathematics, Stevens Institute of Technology, Hoboken, NJ
I think what follows reflects this spirit.
Ancient Understandings of the World: Flat or Spherical?
When did people first realize that the earth might be round rather than flat? Apparently, Aristotle in the fourth century B.C. was convinced of the earth’s sphericity, because he observed its shadow on the moon during a lunar eclipse. Less scholarly people such as sailors also thought the world might be round because they observed that the sails on ships approaching the horizon seemed to dip into the ocean.11
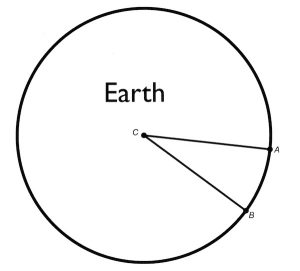
But how round was the earth? No one had any idea, at least not until a curious and ingenious librarian named Eratosthenes (275–194 B.C.) discovered a remarkably simple method for measuring the circumference of something as large as the earth. He may have considered three methods: (1) direct measurement, (2) measuring the earth’s diameter, and (3) finding the central angle of the earth with shadow measurements.
The first and most obvious way would be to circumnavigate the earth and keep track of the distance traveled. Traveling across land would be hard enough, but crossing oceans would be impossible, so Eratosthenes must have quickly ruled this possibility out.
In the second method, one could approximate the measurement indirectly by taking a trip through the center of the earth and measuring that distance. Then the fact that the circumference of the earth is a little more than three times its diameter could be used to make the approximation. But without a powerful machine that could cut such a tunnel, he surely shelved this idea as a child’s fantasy.
In the third method one could find the circumference of a circle by measuring the central angle of the earth (angle C). Knowing that there are 360 degrees in a circle helps us figure out how many ACB-sized “slices” would fit in the circle. If angle ACB is 60 degrees, then six slices would fit. This means that six distances (arc lengths) between points A and B would fit around the circle, so all that we have to do is multiply the arc lengths by 6 to find the circumference. That’s easy enough. But we still have the problem: How would Eratosthenes get the measure of angle C – the central angle of the earth? As it turns out, his brilliant insight was to study shadows!
Eratosthenes’ Most Amazing Discovery:
The “Sun” Angle and the Central Angle Are the Same!
One day Eratosthenes read in a papyrus book that at noon on June 21 in the frontier outpost town of Syene, vertical sticks cast no shadow and a reflection of the sun could be seen at the bottom of the well. As a scientist, he wanted to know if the same thing happened in Alexandria. He waited for June 21 of the following year and then discovered that a distinct shadow could be seen at noon in that city – something he hoped would happen since he assumed the earth was round. But how round was it?
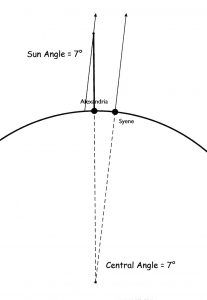
In Figure 2, no shadow is seen at Syene while there is a shadow in Alexandria. Also, the “sun” angle in Alexandria is equal to the central angle, because they are alternate interior angles formed by a transversal line intersecting the sun’s parallel rays. So, if the sun angle can be determined, then the central angle can be found (when there is no shadow at the other site as is the case here.)
But what happens if there are shadows at both sites?
The Great Discovery and Its Significance
If you study figure 4, you will see that the central angle equals the difference of the two sun angles. This means that if you can measure the sun’s angles at two different positions on the earth when the sun Is highest in the sky, then you can figure out the central angle! Let’s look at an example to see how this information leads us to determine an empirical value for the circumference of the earth.
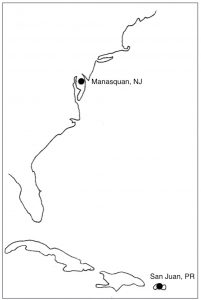
We’ll choose two places (figure 3) that are fairly far apart on the earth’s surface: Manasquan, New Jersey, and San Juan, Puerto Rico to do the measurements.
Method 1: Using Scale Drawing
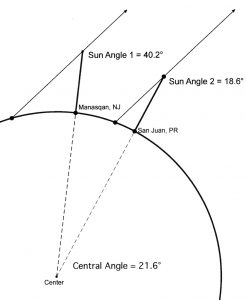
At local noon (that is, when the sun is at its highest point in the sky) on the same day, each set of experimenters measures the shadow cast by a meter stick. In Manasquan, the shadow’s length measured 80.5 centimeters. In San Juan, the shadow length was 35.3 cm. The next step is to figure out the sun angles at Manasquan and Puerto Rico. A protractor can be used to measure these angles or create a Sketchpad model to scale as I did (Figure 5).
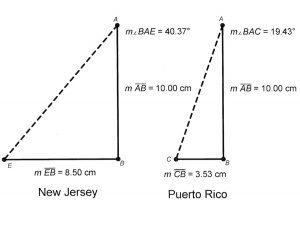
Now the central angle of the earth equals the difference between these angles, which is 40.37 minus 19.53, or 20.84 degrees.
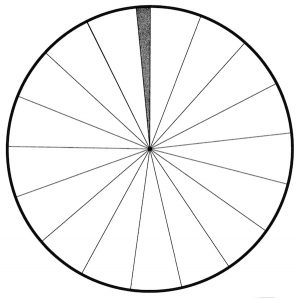
Now that we know the central angle, we can determine how many such angles would make up the full circle; that is, how many “slices” can we make that have an angle of 20.84 degrees? Because the total circle is 360 degrees, you would have about 17 equal “slices.”
Each slice’s edge represents the distance between Manasquan and San Juan, or, more accurately, the north-to-south distance between each site’s line of latitude. Manasquan, New Jersey is located at 40.13N 74.05W, while San Juan, Puerto Rico is at 18.47N 66.12W. Notice that the north-south latitudinal distance between these sites is 40.13 minus 18.47, or 21.66 degrees, which is approximately 2,404 kilometers (km), if we use 111 km for each degree of latitude. Of course, Eratosthenes did not have such luxuries as accurate maps, and he certainly did not know that each angle of latitude was approximately 111 km in length. But to understand this experiment, we will take a few 21st-century liberties. Based on the data given, the length of the “slice” is about 2,400 km. Because we have approximately 17 slices, the projected circumference is 2,400 times that: 2,400 × 17 = 40,800 km. This is off by about 2% when we compare it to the benchmark distance of 40,008 km for the earth’s circumference.
The Noon Day Collaborative Project
Every March and September, you and your school can participate in this collaborative project with other schools and re-create Eratosthenes’ measurement of the earth. Please visit the Web site at http://ciese.org/curriculum/noonday for more information, lesson ideas and updates. You can also contact me at ihor@dmcpress.com for more information.
Notes
1. The Logical Journey of the Zoombinis. (2000). Learning Company.
2. Gary Stager. Learning Adventures: A new approach for transforming real and virtual classroom environments. A paper written for the ACEC 2008 conference in Perth, Australia. http://stager.org/articles/72Stager.pdf.
4. Here’s a typical assessment of math students’ knowledge of math in the fourth grade. According to Conceptua math when students hit fourth grade, many begin to lose confidence in their ability to do math. Like most vendors, Conceptua math has something special that they believe flattens the fractions barrier for most students and will prep them properly to pass the tests. But how well they do that is still an open question in my mind.
5. Hess, F. (2013). Breakthrough Leadership in the Digital Age: Using Learning Science to Reboot Schooling, p. xiii. “The question that motivates this book is ‘Given what we know about learning, how can new technological tools help promote great teaching and learning?’ The good news and bad news about technology and learning are one and the same. Schools have not yet begun to systematically tap learning science through technology to deepen, accelerate, and nurture learning. The ‘bad’ here is obvious. So what’s the ‘good’ news? It’s that, since we mostly haven’t figured out the right way to put things together, we’re in a position to make enormous progress by tapping emerging tools and technologies the right way.”
6. Xerox Corporation. (1970). The Weird Number. https://www.youtube.com/watch?v=pSO66sL9SmY.
7. Read more about the Hippasus story in Brian Clegg’s “The Dangerous Ratio.” http://nrich.maths.org/2671. An alternative to creating a video would be to do a comic book project using http://pixton.com.
8. A professor of math education used the Weird Number video as a motivator for a lesson development assignment by his students. Here’s what they came up with. http://edu320. blogspot.com/2006/09/weird-number.html.
9. http://stockmarketgame.org.
10. htp://www.ciese.org/math/elizabeth/Stocks6thgrade.html.
11. This part is based on an article I wrote for ISTE (International Society for Technology in Education), “In the Spirit of Eratosthenes: Measuring the Circumference of the Earth,” in 1998.
12. http://www.amazon.com/The-Librarian-Who-MeasuredEarth/dp/0316515264.
13. According to Carl Sagan’s book Cosmos, Eratosthenes hired a surveyor to pace the distance from Syene to Alexandria, approximately 800 km.
14. http://ciese.org/curriculum/noonday.
*Wannado is a heightened form of “want to do” as opposed to “have to do.”