Introduction
One of the reasons
probability is a favorite attraction is that it can
lead to many surprises along with some useful math
done in interesting ways. The challenge in this
activity is to see if students can make a prediction
about the likelihood of toothpicks landing on lines
when dropped randomly using experimental data.
Target grades: 8-10.
Preliminaries
- Make a set of shoe
box tops toothpick tossing “arenas”.
- Draw equidistant,
parallel lines inside the shoebox top or on a piece of
8.5 x 11 sheet of paper. The distance between the
lines should be the same as the length of the
toothpicks. Make one of these for each of your groups.
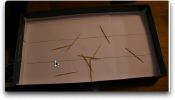
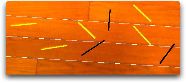
Note: If you
don't have the boxes, you can also demonstrate the
experiment by dropping the toothpicks on a tiled floor.
Here I dropped a bunch on a hardwood floor. (See photo
below.) I highlighted the toothpicks and lines on the
floor. An adjustment will need to be made since the
toothpicks will not be the same as the perpendicular
distance between lines.
Setting the Stage
- Have your students
sit in groups or teams. You are facing them standing
next to your one computer station.
- Tell the students that
they will be answering a question that was originally
posed by a man named Georges-Louis Leclerc, Comte de
Buffon about 250 years ago. But first...
- Show this video (1:20). Ask the
students what they notice and have them take 2 minutes
to share with their neighbor(s). Ask volunteers to
share what they noticed with the class. Repeat with
what they wonder about. (If you are new to this
"notice/wonder" strategy watch this video.)*
- Suppose we have a floor
made of parallel strips of wood, each the same width,
and we drop a needle onto the floor. What is the probability
that the needle will lie across a line between two
strips?
- Take guesses from
your class. Then ask them to explain their guess.
- Ask them: How might
we proceed to find out which student or group made the
best guesses? Let’s do the experiment to help us find
out.
Doing the Activity
- Show them an "arena"
for the experiment.
- Hand out the activity sheet. Make
sure the students understand the instructions.
- Each group will drop a
total of 100 toothpicks 10 at a time on their parallel
lined arena.
- Students toss the
toothpicks and record them on the student sheet. When
finished each group will share their results via a spreadsheet
projected onto the white board by the teacher.
- Students help the
teacher to complete the summary spreadsheet.
- After finishing, ask
the students how they might come up with even a better
or best "guess"? (Theoretical probability is 2/Pi** or
approximately .6366.) Who had the best estimate in the
class? Compare the group results with the individual
group guesses to determine who had the closest
estimate. (That is, the group that came closest to
.6366)
Debriefing the activity and what
about the surprise?
- Go to this website again.
- Note the number that is
constantly changing. Does it seem to be getting closer
to a well known constant? It's Pi - approximately
3.14159.
- How did Pi get into the
act? Double
the number of your individual throws and divide it by
the number of crosses. What do you get? Check with
other groups. What can you conclude? (Your answer is
an approximation for Pi.)
- Why does this happen?
(See George Reese's explanation.)
Additional
Resources
- Here's alternative lesson
plan.
- Here's a cool article
about Buffon's
experiment.
- Watch this simulation.
1:17 min video.
- Another good
example with some more advanced techniques.
- Pi
toss demonstration.
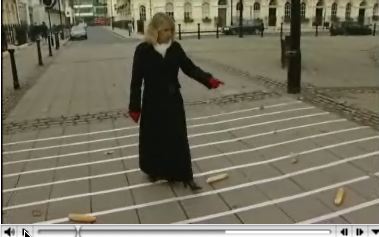
- Estimating
Pi 2:07 min video. Teacher TV. Buffon's needle
experiment done using french bread and taped lines!
-
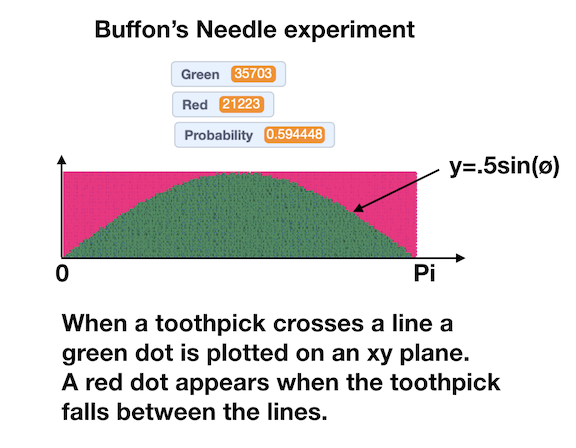
- Imagine throwing a
green dart onto an xy plane (dartboard) when a
toothpick crosses a line and a red dart when the
toothpick lands between the lines. After over 56,000
throws here's what the dartboard looks like.
- To see the actual
simulation done in Scratch go here.
- In the simulation above,
the number of throws was 56926 (35703 + 21223). So if
we double the number of throws (113825) and divide by
the number of crosses (green dart hits: 35703) you get
3.18... which is a reasonably close approximation to
π.
*You can stop auto play in
YouTube by switching to off the auto play switch which
is in the upper right hand corner of YouTube.
**This formula works when
the toothpick length is the same as the perpendicular
distance between the lines.
|