| Lesson:
Estimating Heights |
|||
|
Details
You can begin by telling the class that yesterday you received an unusual letter that arrived in the mail.You then read the letter to the whole class. (The letter is on a transparency and placed on the overhead projector or projected off the computer screen so the whole class can read along.)
| Dear
Students, I am an anthropologist from Canada who investigates changes in human body size and shape over time. I have been working on comparing the differences in heights of people who lived during the 19th century and the present. Unfortunately, I don’t always have complete skeletons of the 19th century folks to work from. I do have many radius bones that I dug in a pioneer graveyard. Here is where I
need your help. Since my math is bit shaky and I
heard through the grapevine that you guys are
the best! Is there a way to predict the height
of a person by just knowing the length of the
radius bone?
(In case you don’t know the radius bone extends from your elbow to your wrist.) |
 Radius bone I hope you can help me.
Sincerely, Shelly |
Next, you ask the class for suggestions
about how they might help Shelly. Hopefully, the
students will suggest that if they do some measurements
they might discover some patterns that may lead to some
predictions. The students, working in small
groups, measure the radius bone and height of each
student in the group. (Each group gets a recording
sheet like the one below and a measuring device.)

After each group completes their
measurements, a spokesperson from each group reports
their results to you so you can record them and then
project the results so that the whole class can see all
the measurements.
You then ask your students if they see any patterns. After some discussion, you might suggest that the students draw a graph using a spreadsheet program like the one below.
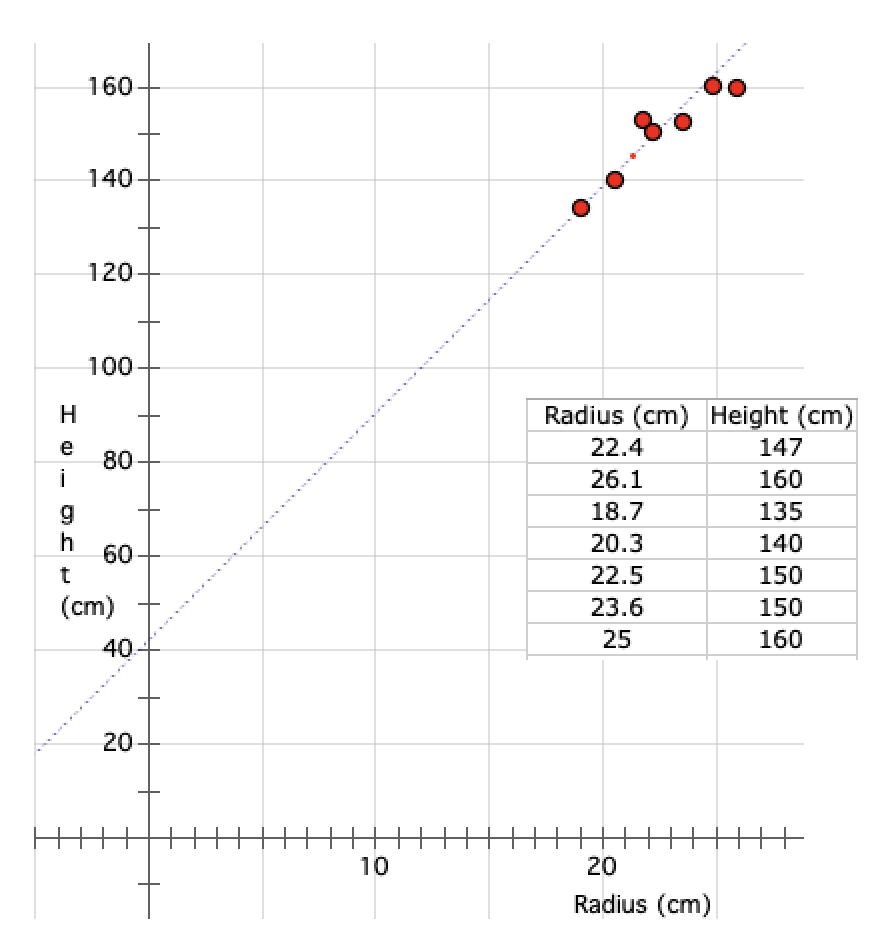
You then ask your students if they see any patterns. After some discussion, you might suggest that the students draw a graph using a spreadsheet program like the one below.
You ask: What can you tell me about
the graph? (It’s linear.) The best we can do is draw
a line of "best fit" since the data points do not
fall neatly on a straight line. We can then use this
line to make predictions. For example, if someone
has a radius bone that id 17 cm, what would you
guess his or her height might be? (Answers will
vary. A student might come up and suggest where the
point with a radius value of 17 should be placed on
the graph (the line). Is it possible for someone to
have a 17 cm radius bone and have a height of 170
cm? (Not very likely, but possible.) Why?
What if Shaq O'Neil (former Miami Heat basketball player) walked into the room? Could you predict the length of his radius bone? (O'Neil is 7’ 2” tall. The students will have to convert his height to centimeters.) How confident are you about your prediction?
“Going further” questions
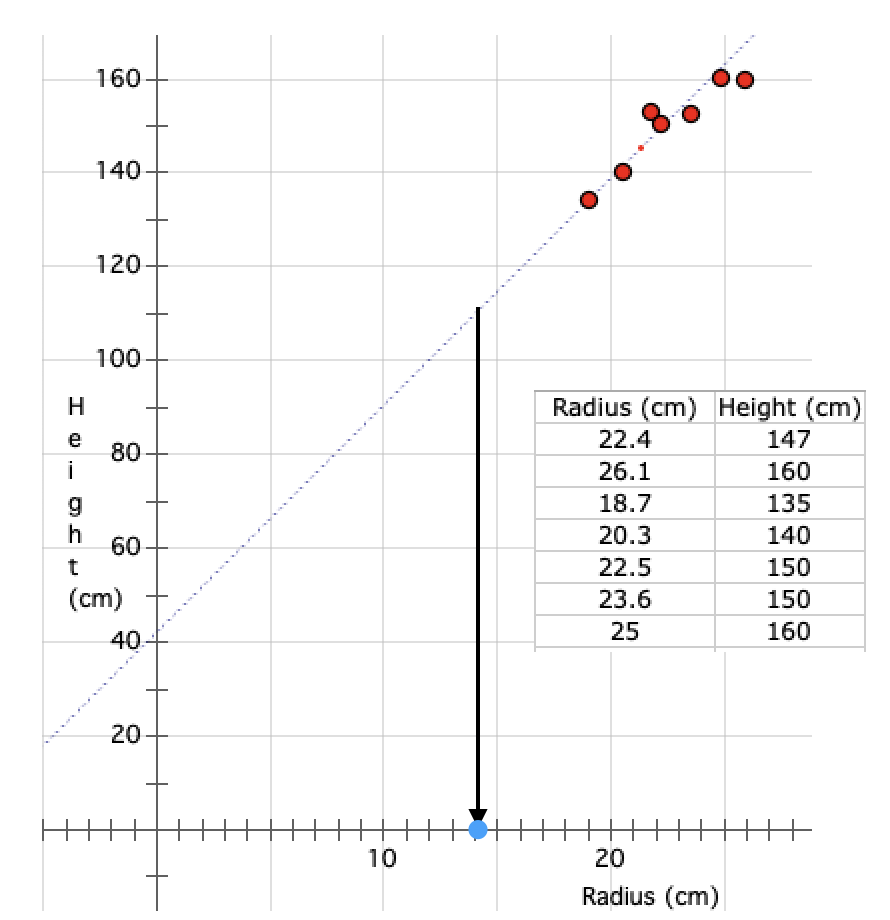
In 1951 Eddie Gaedel* batted one time for the St. Louis Browns.

Needless to say, he walked. Eddie was 3' 7" (110 cm) tall. What was the size of his radius bone? Use the graph above to predict the length of his radius bone. Here's the projected graph. The length of his radius bone should be 14 cm.
Next, tell the students that they can come up with a mathematical equation for this line of "best fit" or line of regression which is its official name. If they are using a spreadsheet then they can create an x y scatter plot. Be careful not to let them see the spreadsheet's equation for the regression line that you will eventually show them.
The teacher then helps them to come up with an equation that would fit this data by playing the game they are probably familiar with: Guess my Rule. The hint is to first multiply the the length of the radius bone by a whole number then add a number to it.
Once each group agrees on a prediction for the equation, the spreadsheet can be used to confirm their guesses. (The group that comes the closest would be the winner of this Guess my Rule game!)
The class could also explore other examples of mathematical relationships. For example, they can through experimentation discover that he relationship between the Fahrenheit and Centigrade temperature scales are related by the formula F = 9/5 C + 32. Students can approach this problem in the same way. They take temperatures in both scales, draw a graph, and then determine an approximation for the relationship. Another example, would be to determine the temperature outside based on how fast crickets chirp (See Crickets lesson.)
* More on Eddie Gaedel
What if Shaq O'Neil (former Miami Heat basketball player) walked into the room? Could you predict the length of his radius bone? (O'Neil is 7’ 2” tall. The students will have to convert his height to centimeters.) How confident are you about your prediction?
“Going further” questions
In 1951 Eddie Gaedel* batted one time for the St. Louis Browns.
Needless to say, he walked. Eddie was 3' 7" (110 cm) tall. What was the size of his radius bone? Use the graph above to predict the length of his radius bone. Here's the projected graph. The length of his radius bone should be 14 cm.
Next, tell the students that they can come up with a mathematical equation for this line of "best fit" or line of regression which is its official name. If they are using a spreadsheet then they can create an x y scatter plot. Be careful not to let them see the spreadsheet's equation for the regression line that you will eventually show them.
The teacher then helps them to come up with an equation that would fit this data by playing the game they are probably familiar with: Guess my Rule. The hint is to first multiply the the length of the radius bone by a whole number then add a number to it.
Once each group agrees on a prediction for the equation, the spreadsheet can be used to confirm their guesses. (The group that comes the closest would be the winner of this Guess my Rule game!)
The class could also explore other examples of mathematical relationships. For example, they can through experimentation discover that he relationship between the Fahrenheit and Centigrade temperature scales are related by the formula F = 9/5 C + 32. Students can approach this problem in the same way. They take temperatures in both scales, draw a graph, and then determine an approximation for the relationship. Another example, would be to determine the temperature outside based on how fast crickets chirp (See Crickets lesson.)
* More on Eddie Gaedel