Part
2: Here I want to explain in a bit more detail
George Reese's excellent
description of the simplest case of the needle
experiment.
Determining the probability that a dropped
toothpick will cross on a line.
 Click above to download Sketchpad
sketch
Click above to download Sketchpad
sketch
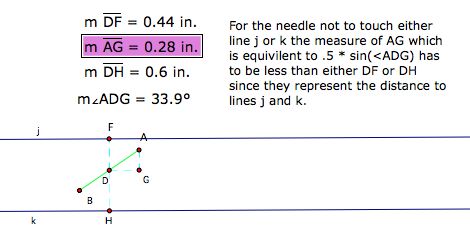
By definition the sine of angle ADG is the length of
the opposite side (AG) divided by the hypotenuse
(.5). Therefore, AG = .5 * sin <ADG.
Note that in the diagram
above AG is shorter than both DF and DH. If AG is
greater than either DF or DH there would be a
crossing. Download and experiment with the sketch to
confirm this.
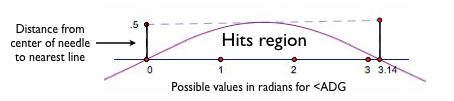
If we graphed our data we
could see that the hits occur in a special region of
the rectangle.
The distance between the lines is 1 inch. The needle
is one inch. So the midpoint that's closest to
either j or k will be somewhere between 0 and.5 from
the line. However if neither of the segments is
greater than AG the point would plot above the curve
and not counted as a hit.
The area under the curve is 1. The area above the
curve is .5 * Pi - 1 or approximately 1.57. So the
probability would be 1 / Pi/2 = 2 / Pi. So if the
rectangle was a dart board, and every point on the
board was a possible the probability would be 2/Pi
or .6366197 almost 2/3 of the needles will cross a
line.
Back
to part 1.
Updated: 3.19.26 |