
| WhatŐs needed... Resources: Shoe box tops; toothpicks; computer applet and Geometer's Sketchpad Classroom Environment: Students in groups with access to computers; teacher demonstration station. Strategy: Groups work together to
come up with
a
group prediction through experimentation. |
Introduction
One of the reasons probability is one of my favorite topics to teach is because it can lead to many surprises along with some useful math done in interesting ways. The challenge in this activity is to see if the students can make a prediction about the likelihood of toothpicks landing on lines when dropped randomly using experimental and theoretical data.
Preliminaries
- Make a set of shoebox top toothpick tossing ŇarenasÓ.
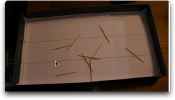
- Draw equidistant, parallel lines inside the shoebox top. The distance between the lines should be the same as the length of the toothpicks. Make one of these for each of your groups.
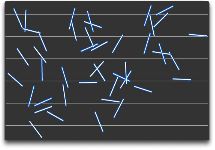
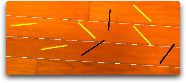
- If you don't have the boxes, you can demonstrate the experiment by dropping the toothpics on a tiled floor. Here I dropped a bunch on a hardwood floor. (See photo below. I highlighted the toothpicks and lines on the floor.)
- The toothpicks I used were 2.5Ó while the distance between
the
lines
was 2.25Ó which will influence our results a bit. But more about that
later.
Setting the Stage
- Have your students sit in groups or teams. Your facing them standing next to your one computer station. (Maybe even projecting on a digital white board!)
- Tell your class that they will be answering a question that was originally posed by a man named George Louis Leclerc, Comte de Buffon about 250 years ago. The problem goes something like this: What is the probability that a toothpick when dropped on a set of horizontal lines spaced one toothpick apart will cross a line?
- Take some guesses from your class. Then ask them to explain
their guess.
- Ask them: How might we proceed to find out which student or
group made the best guess? LetŐs do an experiment to help us find out.
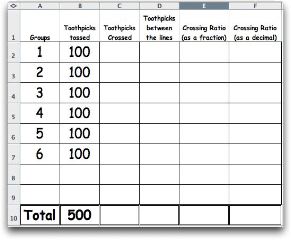
- Hand out the activity sheet. Make sure the students understand the instructions.
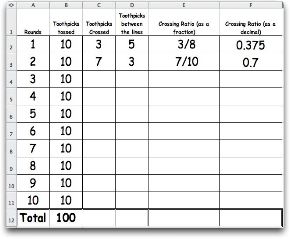
- Each group will drop 50 toothpicks 10 at a time on their parallel lined arena.
- Students toss the toothpicks and make their predictions about what the class crossing average will be.
- By Group - Worksheet 1
- By Class - Worksheet 2
- Complete worksheet 2 with the class. Who had the best guess? (Compare the group results with individual group guesses.)
- After finishing, ask the students how they might come up with even a better or best "guess"? (Use a computer simulation!)
- Go to this website: http://www.metablake.com/pi.swf
- Can you explain what is happening?
- How did Pi get into this act? Hint: Double your number of throws and divide it by the number of crosses. What do you get? Check with other groups. What can you conclude? (Your answer is an approximation for Pi.)
- Why does this happen? Stay
tuned for the next lesson to find
out..
- In the meantime, check out this applet. Explain what is going on.
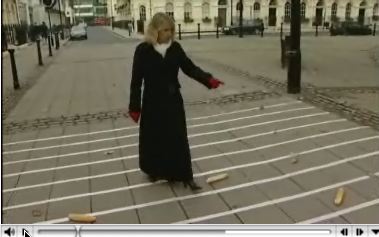
- Estimating Pi. Video. Teacher TV. Buffon's experiment explained using french bread and taped lines!

- New 11.6.10 - another excellent simulation. Calculating Pi
using Buffon's Needle.